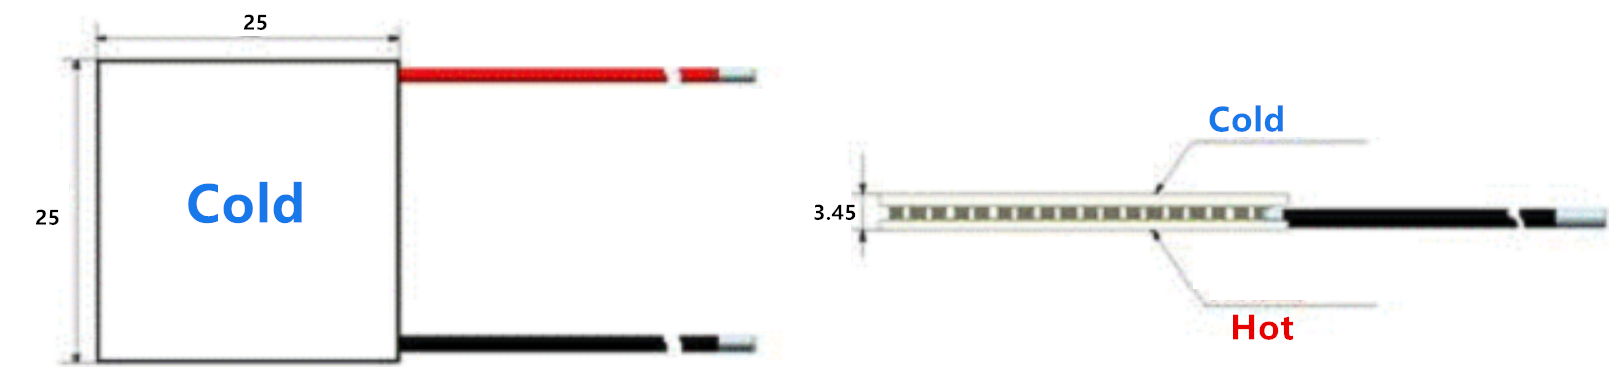
Product Drawing of Thermoelectric Cooler
![]()
Basic Parameters Table
Data based on Cold Side = 30°C, Hot Side = 130°C, ΔT = 100°C
| Model | Alias | Internal Resistance Ri(Ω) at Different Temperatures | | | | | Dimensions (mm³) | | |
| | 30°C | 50°C | 100°C | 150°C | 200°C | Length L | Width W | Height H |
| TEG1-12701 | | 3.72 | 4.02 | 4.77 | 5.51 | 6.25 | 25 | 25 | 3.45 |
Performance Characteristics Table
Typical operating data
| Hot Side Temp. (°C) | Cold Side Temp. (°C) | ΔT (°C) | Open-Circuit Voltage (V) | Open-Circuit Current (A) | Max Output Power (W) |
| 40 | 30 | 10 | 0.50 | 0.11 | 0.01 |
| 50 | 30 | 20 | 1.00 | 0.22 | 0.05 |
| 60 | 30 | 30 | 1.44 | 0.31 | 0.11 |
| 70 | 30 | 40 | 1.92 | 0.40 | 0.19 |
| 80 | 30 | 50 | 2.40 | 0.49 | 0.29 |
| 90 | 30 | 60 | 2.88 | 0.56 | 0.40 |
| 100 | 30 | 70 | 3.36 | 0.62 | 0.52 |
| 130 | 30 | 100 | 4.80 | 0.88 | 1.06 |
| 150 | 50 | 100 | 4.92 | 0.80 | 0.99 |
| 200 | 130 | 100 | 4.69 | 0.69 | 0.80 |
| 200 | 50 | 150 | 7.03 | 1.06 | 1.86 |
Operation Principle
1. Core Physical Principle: The Seebeck Effect
A TEG consists of a series of N-type and P-type semiconductor thermocouples:
When there is a temperature difference (ΔT) between the **hot side and cold side** of the generator, the charge carriers (electrons/holes) in the semiconductor move from the high-temperature end to the low-temperature end due to thermal diffusion.
Electrons in the N-type semiconductor move toward the cold side, and holes in the P-type semiconductor also move toward the cold side, causing charge accumulation at the cold side and thereby generating a potential difference (voltage) between the two ends.
When a large number of thermocouples are connected in series, the total voltage is superimposed, forming a measurable open-circuit voltage. When an external load is connected, current is output.
2. Key Influencing Factors
Temperature difference (ΔT): The output voltage is approximately proportional to the temperature difference; the greater the temperature difference, the stronger the driving force for carrier diffusion, and the higher the voltage and current.
Semiconductor material properties: The Seebeck coefficient, electrical conductivity, and thermal conductivity of the material determine the power generation efficiency.
Internal resistance: This increases with rising temperature and limits the maximum output current; therefore, maximum output power is achieved when the load resistance equals the device’s internal resistance.
3.Workflow Diagram
Hot Side (High Temperature) ↓ Temperature Difference (ΔT) ↓ Charge Carrier Diffusion (Electrons/Holes) ↓ Potential Difference (Open-Circuit Voltage) ↓ Electrical Output to External Load
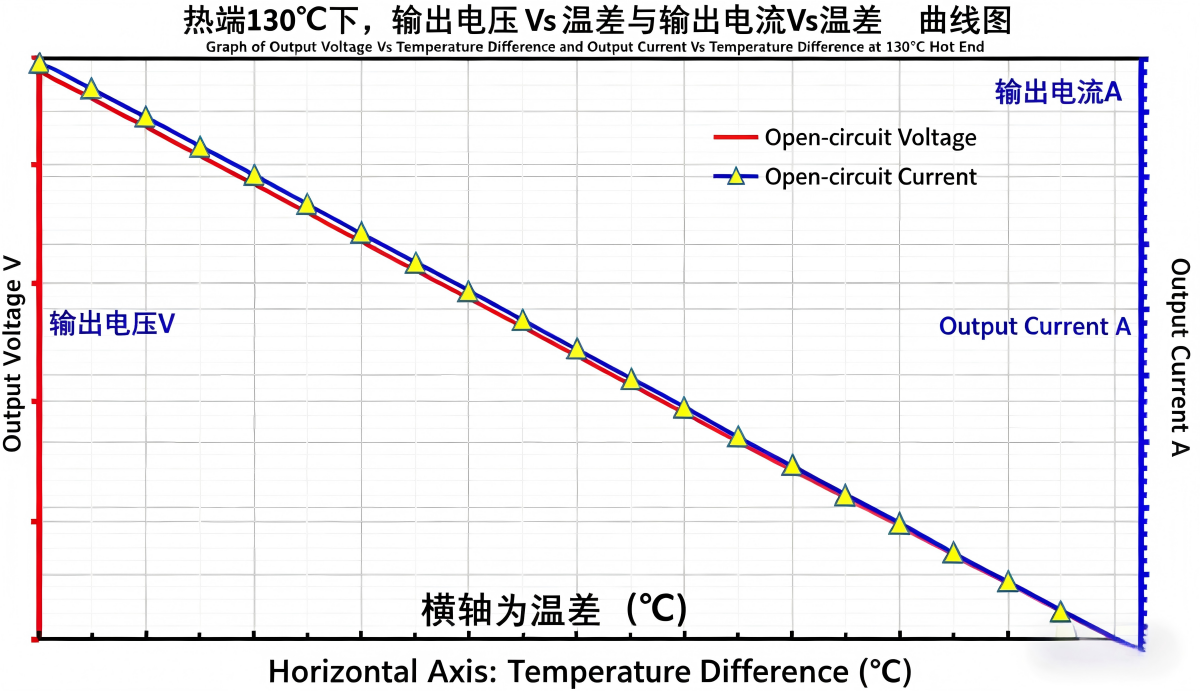
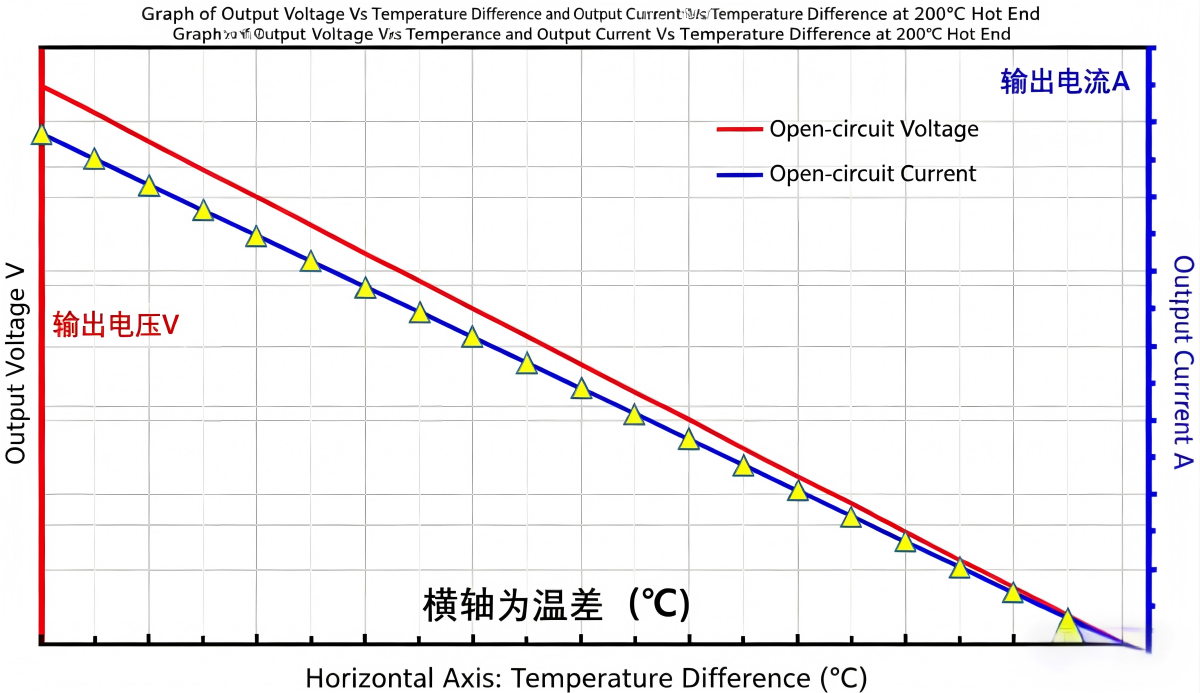
Temperature curve
![]()
![]()
1. The horizontal axis of the graph represents the temperature difference—that is, the difference between the temperatures of the hot and cold surfaces. The greater the temperature difference, the higher the output voltage and current;
2. For the definitions of open-circuit voltage and open-circuit current, refer to P1. Both open-circuit voltage and open-circuit current can be measured with a multimeter when there is no load;
3. The left vertical axis represents voltage data, and the right vertical axis represents current data;


 Get A Free Quote